5.5 The edge-overlap readout
Select the array in the browser and the inspector reports each adjacent pair.
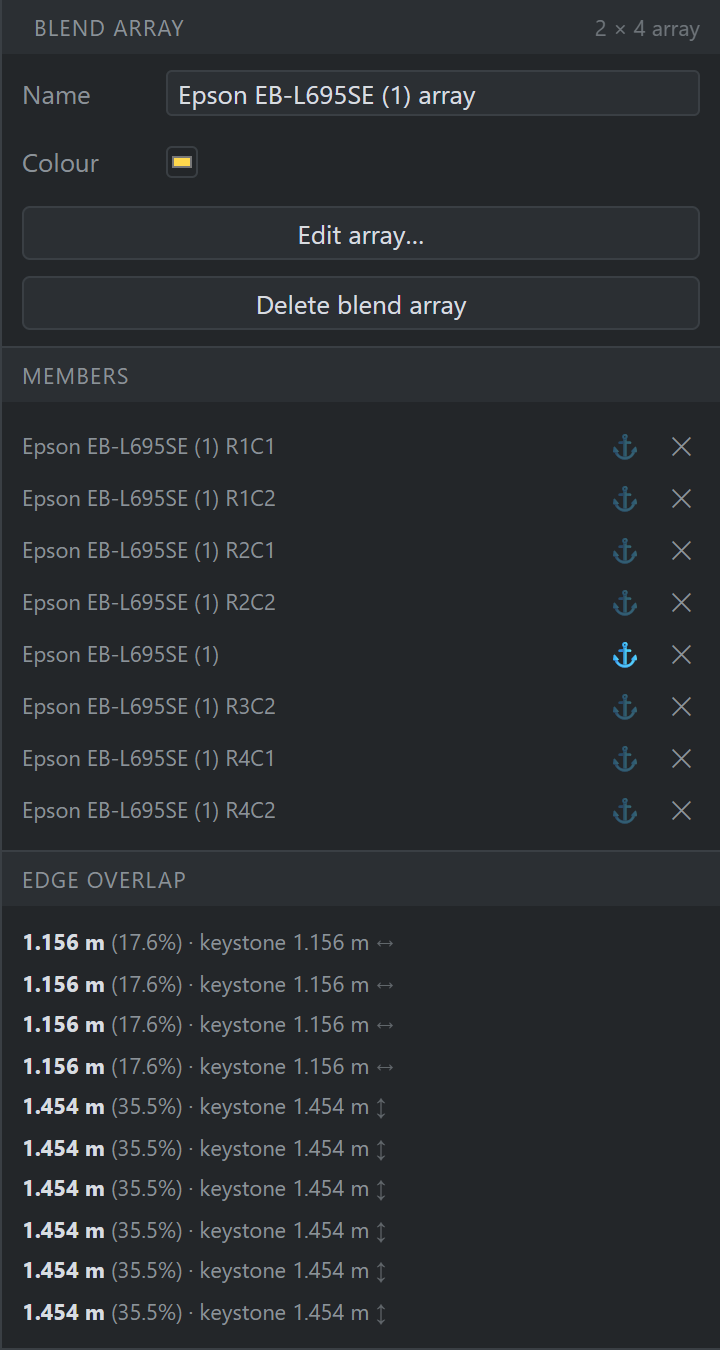
1.156 m (17.6 %) across each row
(↔) and 1.454 m (35.5 %) up each column
(↕), each with its keystone figure beside it.Adjacency is worked out locally — the nearest machine ahead along the run whose offset across the run is smaller — so a grid yields within-row and within-column pairs and no diagonals. A single line behaves exactly as you would expect.
A ring is read from its own spec instead, because no single straight axis describes a circle: the units face a dozen different ways onto a curve. That also means the seam where the last unit blends back onto the first is reported like any other — the pair a chain along an axis could never find.
On a flat wall the keystone figure comes out above the planar one. Round a drum it is the other way: each image is angled away from the straight line between two centres, so it only spans part of it. That shortfall is the curve, and it is the number the blend has to be trimmed to.