6.2 The lux heatmap
What it shows
The light actually landing on a surface: each machine’s lumens spread over the image it makes there, discounted for a beam that arrives at a slant, and added up over every projector that reaches the point. Whatever is in shadow gets none of it.
Three consequences worth internalising:
- Bigger image, dimmer picture. The same lumens are spread over more surface, and it is the area that grows — so brightness falls away faster than the extra width suggests.
- Angle costs light. The more obliquely a beam lands, the further it is smeared across the surface, and the dimmer it reads.
- Overlaps add. A blend region gets both machines’ light, which is exactly why it shows up hotter.
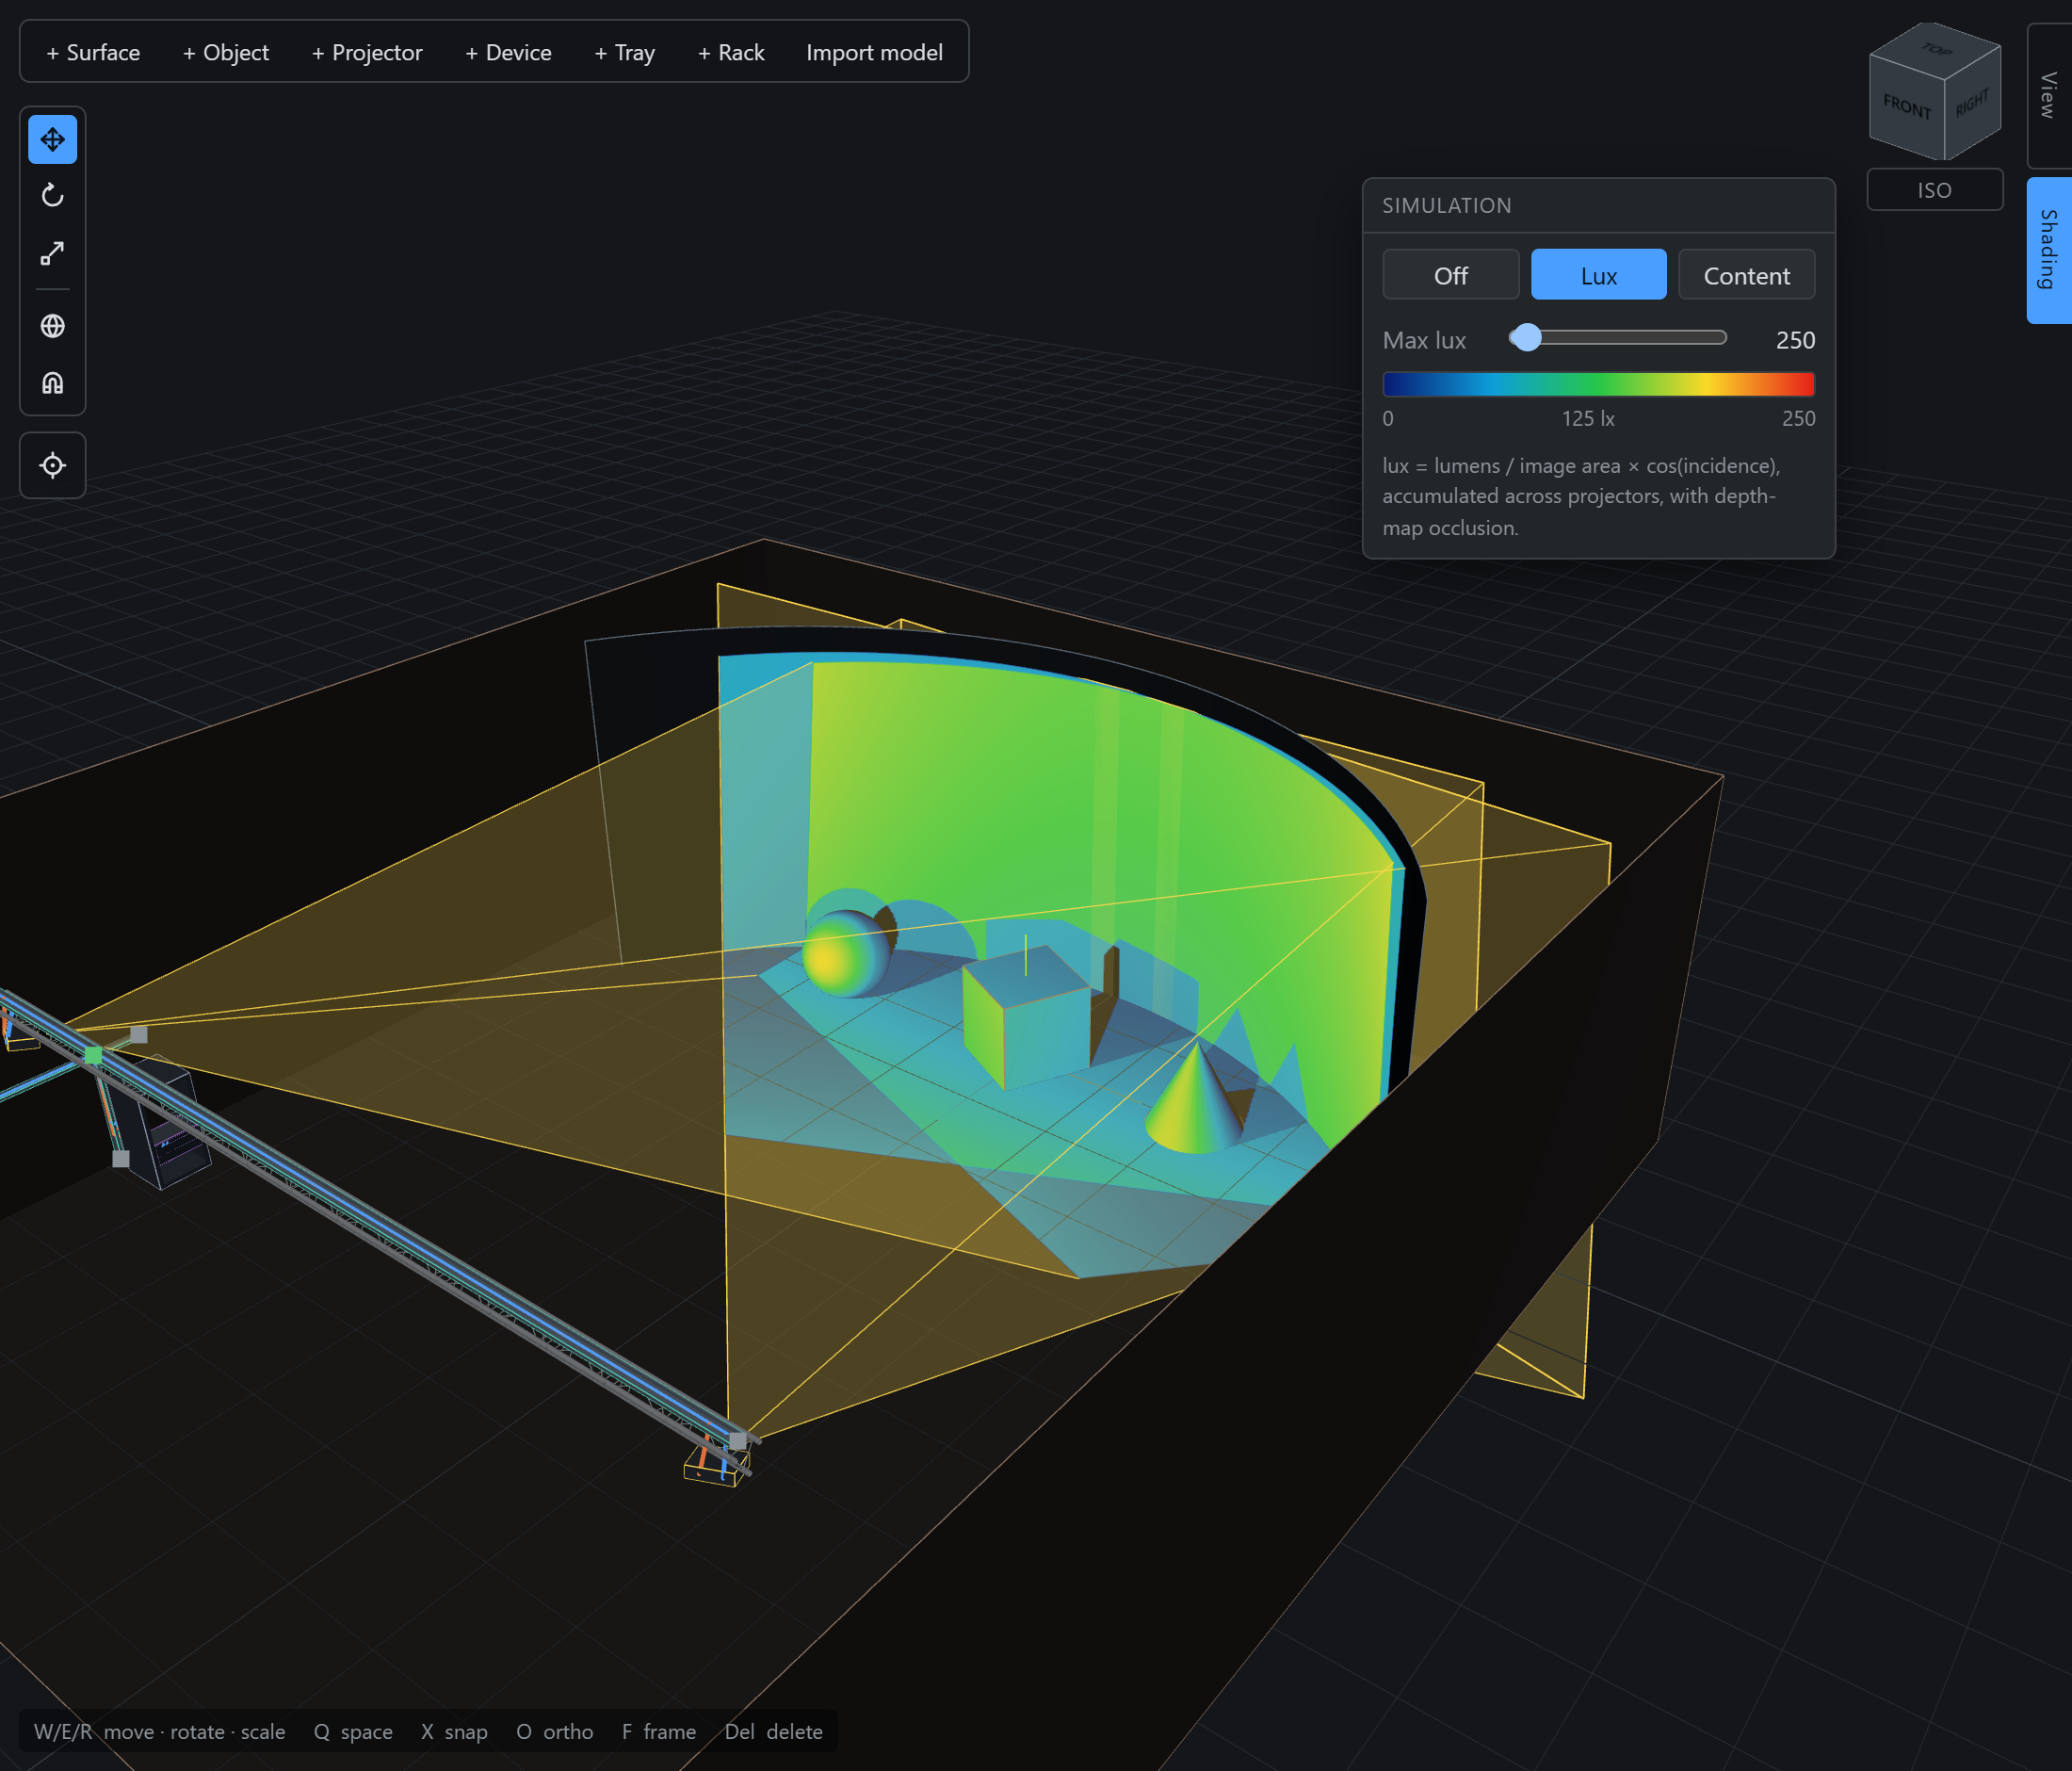
Set Max lux to the top of the range you care about. The default of 1000 lx puts a typical rig’s overlap bands in the middle of the scale.